
MEADE Visual Repository: Artificial Intelligence (AI)

This page displays visual infographics that help to understand AI tools and how they can support teaching. Each image highlights key concepts, practical possibilities, and questions to consider when using AI for course design, feedback, assessment, and planning. The visuals can be used to deepen understanding, spark discussion with colleagues, or support sound use of AI in teaching and learning.
To save any image below:
- Right-click on the image and choose “Save image as…” (on a Mac with a trackpad, use two-finger click or Control-click).
- Choose the folder where you want to store it, optionally rename the file, then click Save.
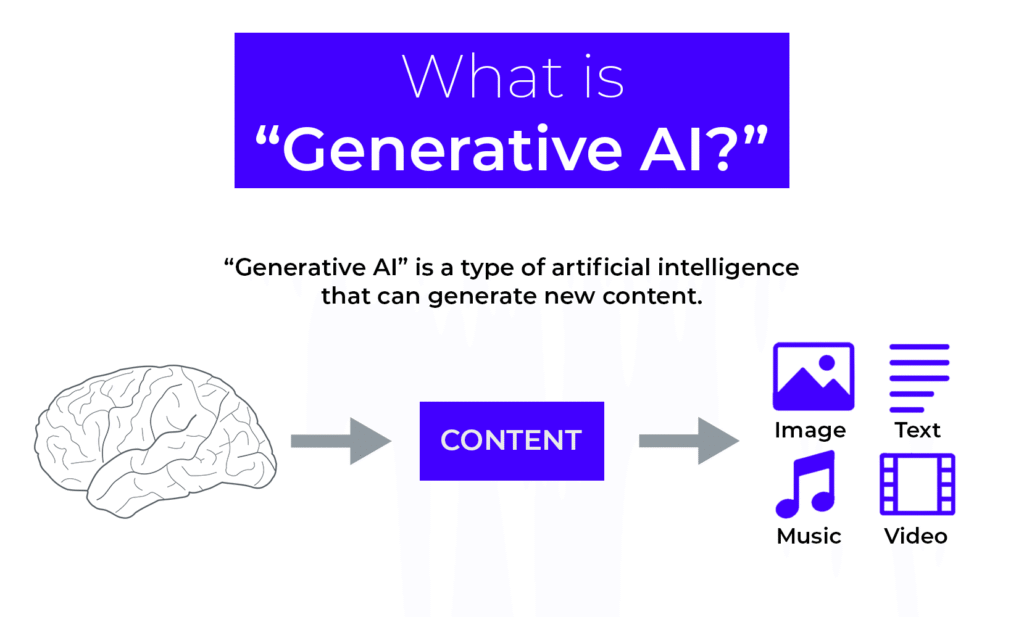
This infographic introduces Generative AI as a type of artificial intelligence. It demonstrates how GAI works to create new content and can be used in conversations about AI in teaching and learning.
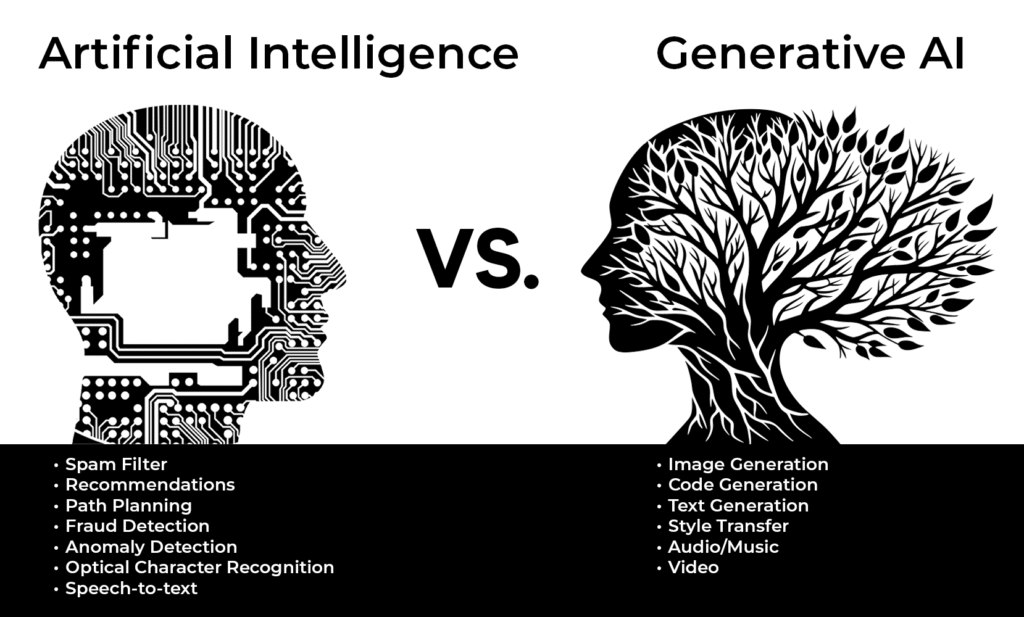
This infographic helps you see the difference between traditional AI and generative AI at a glance.
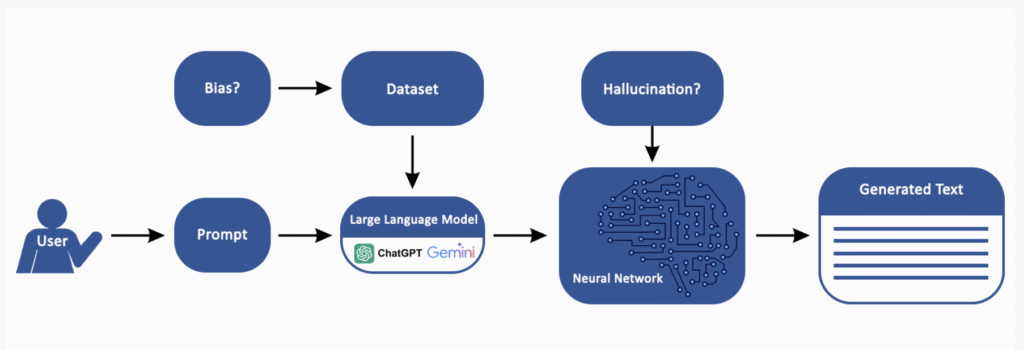
This infographic shows you the different steps AI goes through to to create new content, including use of large language models and factors affecting AI output, such as hallucinations and bias.
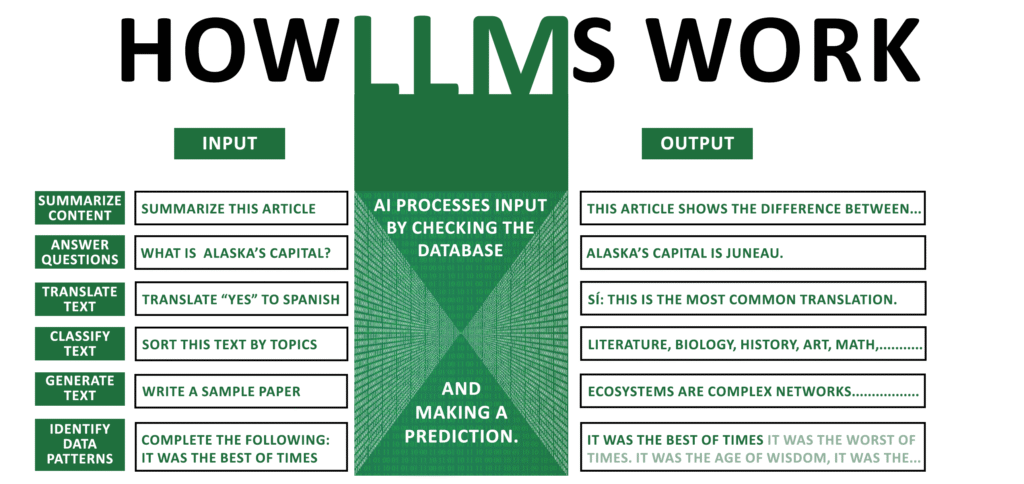
This infographic shows you how large language models respond to different kinds of prompts.
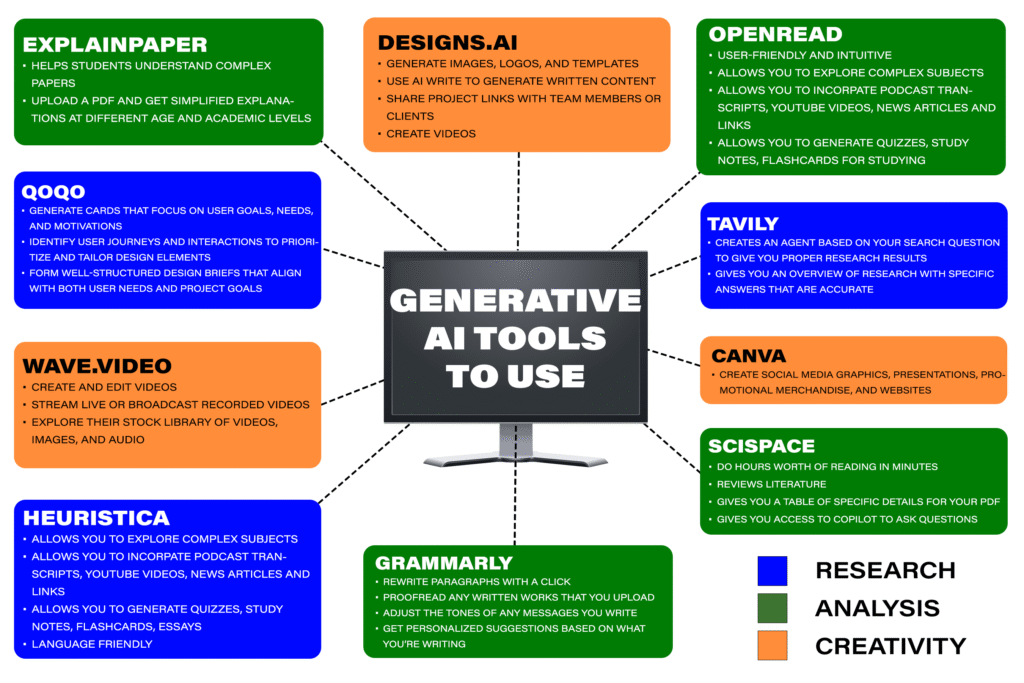
This infographic gives you a quick snapshot of different generative AI tools organized by purpose, including research, analysis, and creativity. Each color-coded box briefly explains what a tool can do.
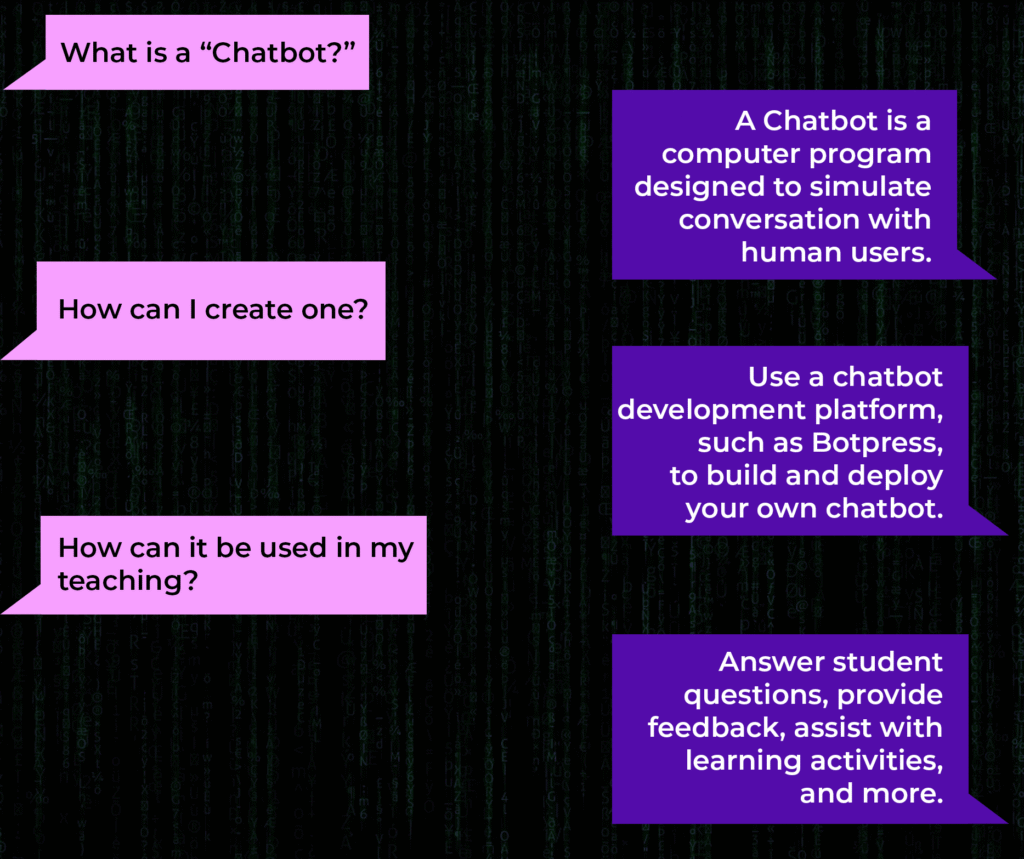
This infographic answers basic questions about chatbots, including what they are and how you can use a chatbot in your teaching.
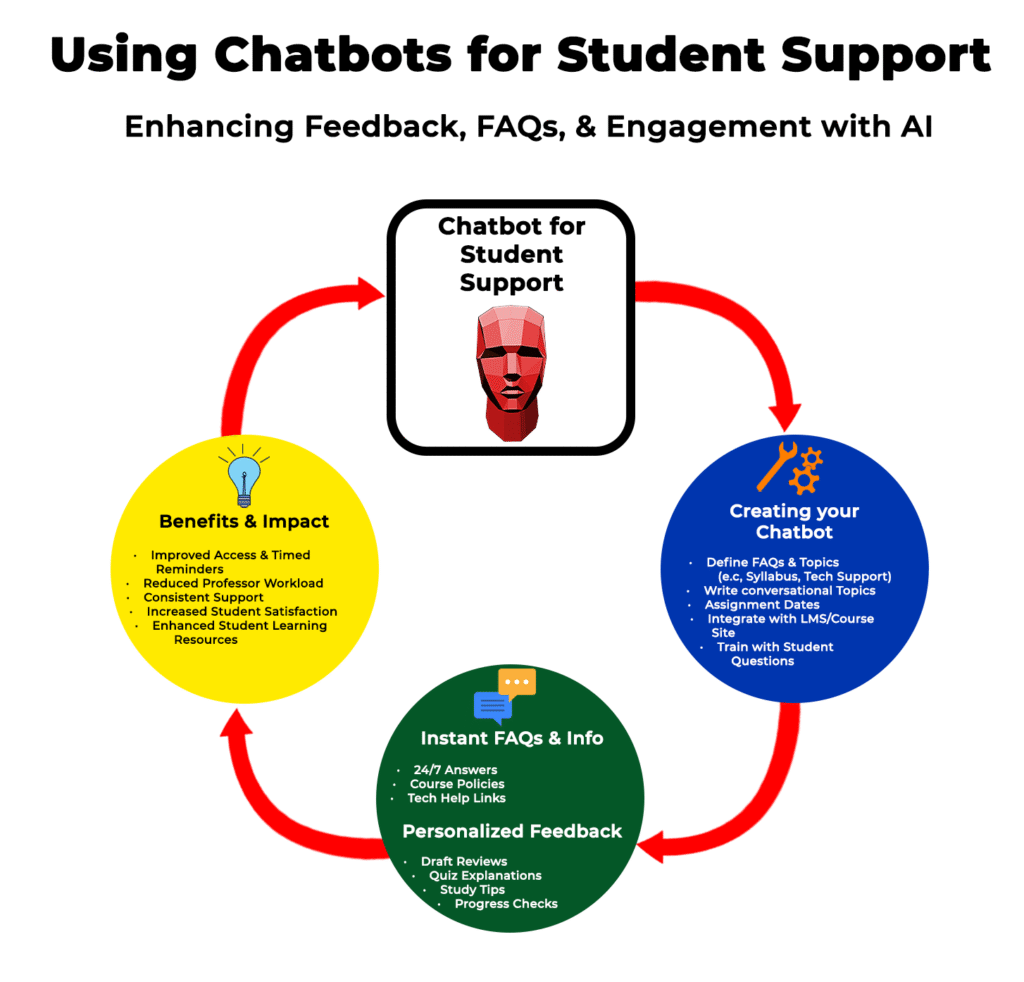
This graphic visualizes how a course chatbot can support your students with FAQs, instant information, and personalized feedback.
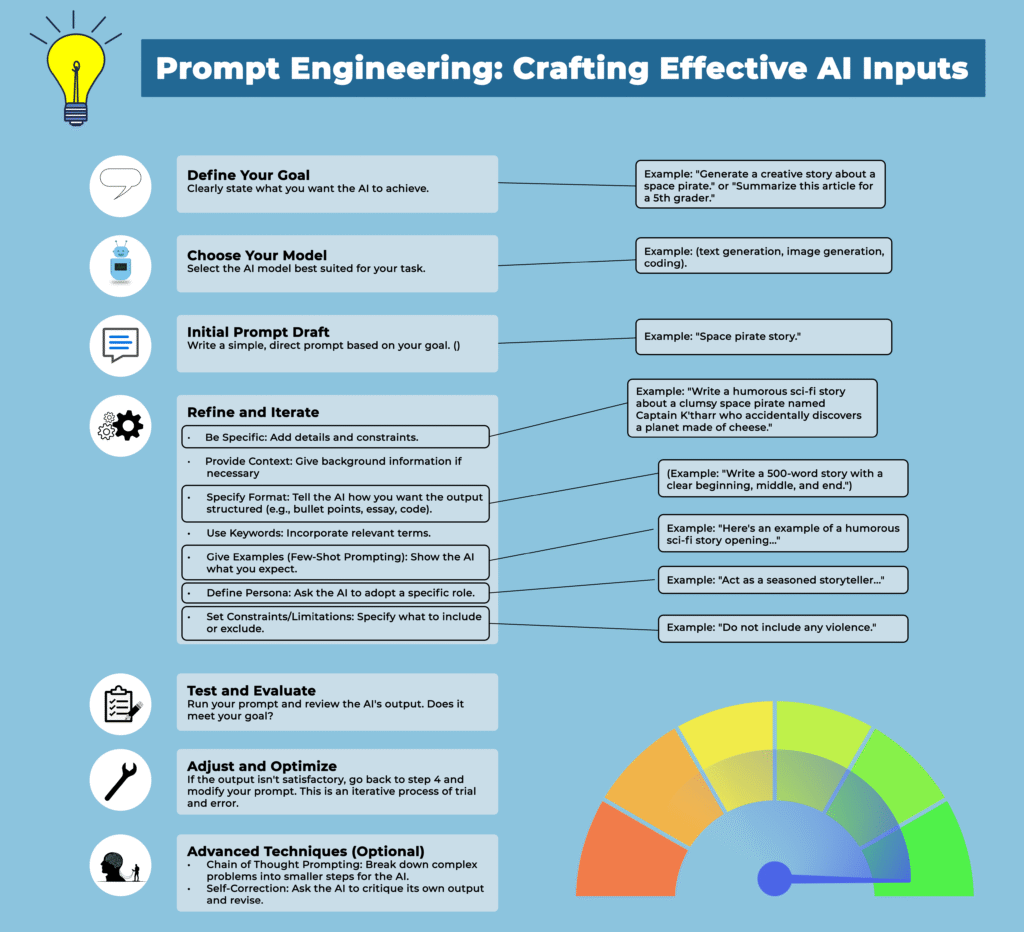
This infographic introduces the basics of how to craft effective AI inputs to maximize outputs.
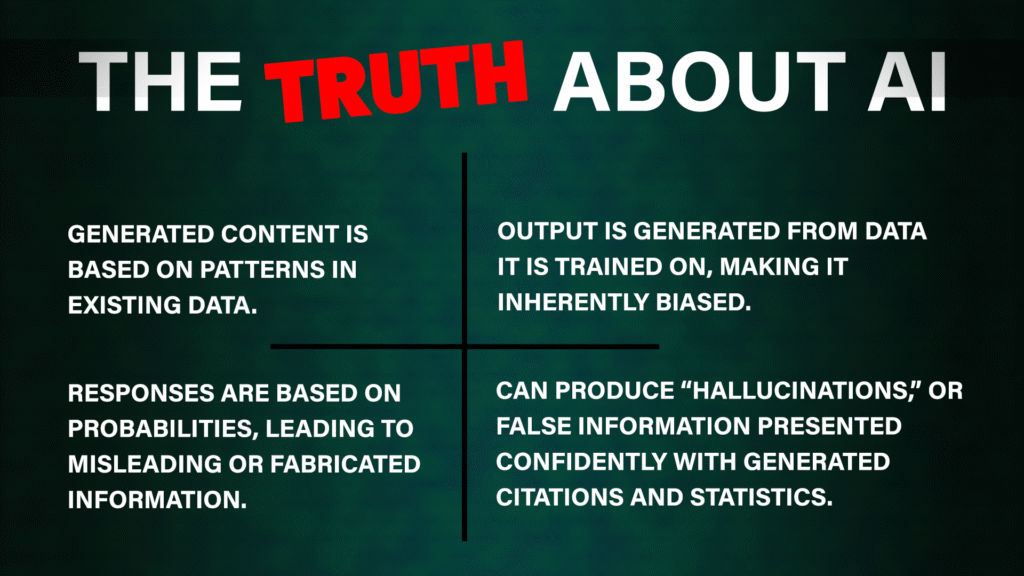
This infographic highlights limitations of AI to keep in mind as AI tools are used.
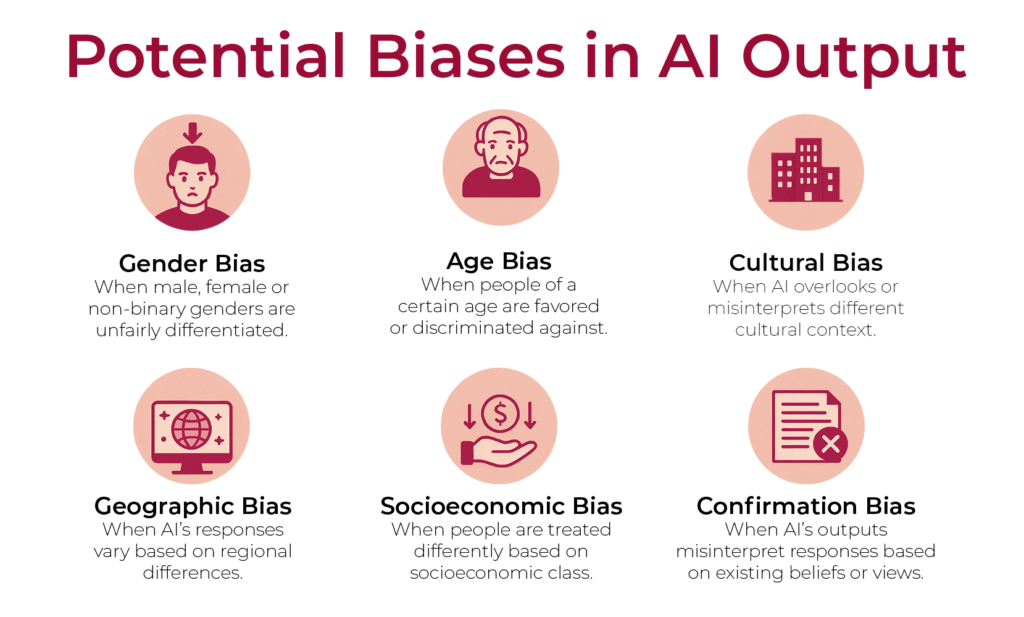
This infographic highlights different kinds of bias that can appear in AI output as well as inequities present in AI data.

